Reading your sales dashboard
The Dashboard is your restaurant's day at a glance. Once your POS is connected, it reads your sales automatically and turns them into the numbers that matter — no typing required. This page explains what you're looking at.
It's the first thing you land on; the title reads Dashboard.
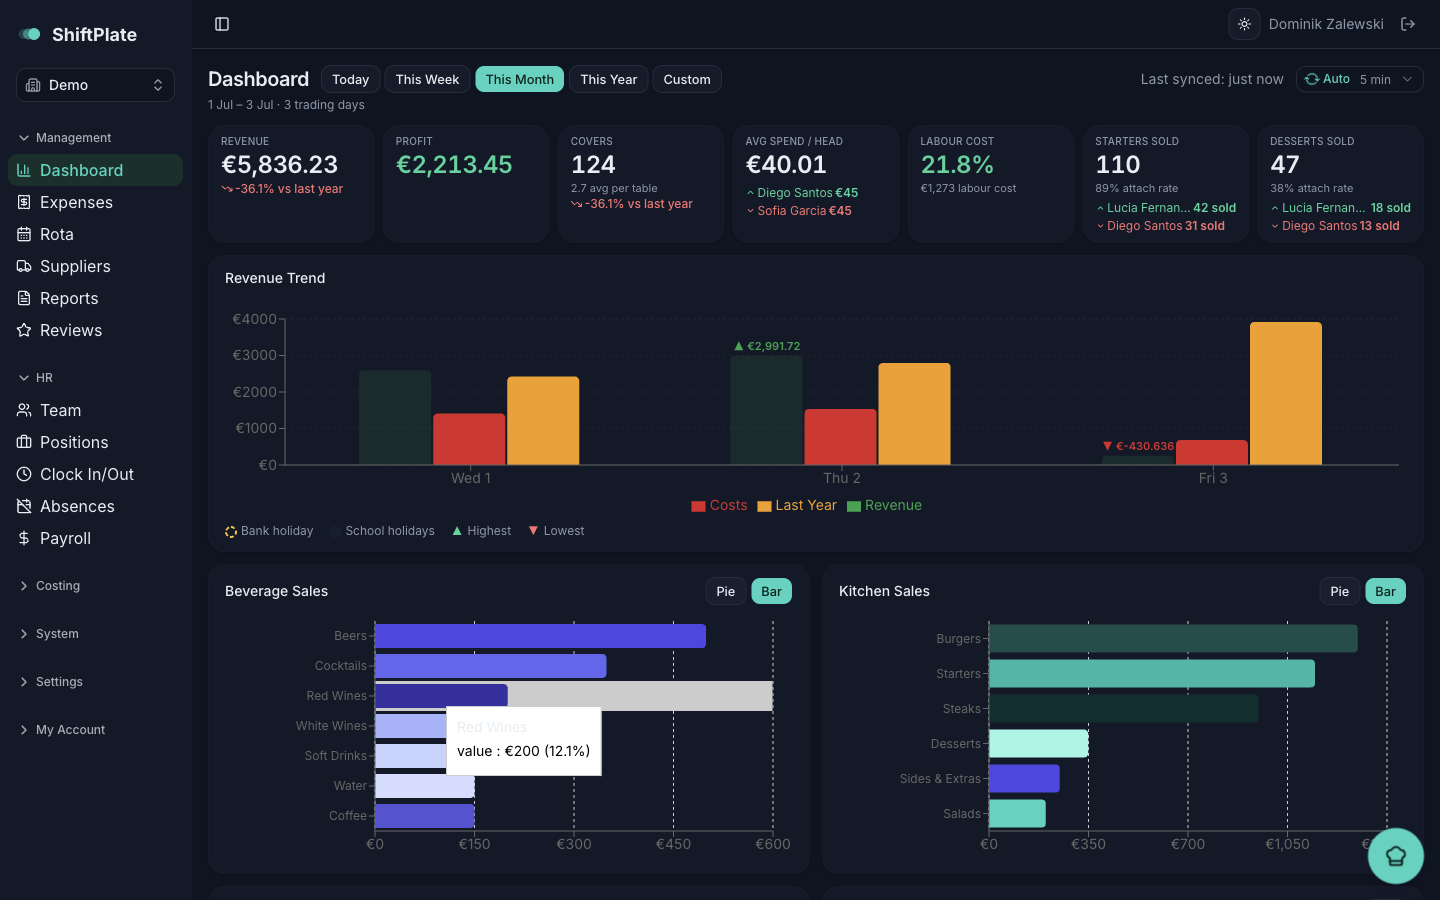
Pick a period
Next to the title is a row of buttons that sets what everything on the page reflects:
- Today, This Week, This Month, This Year
- Custom — pick your own start and end dates
It opens on Today. Switching period re-reads instantly from what's already synced, so you can flick between them freely.
The headline numbers
A row of KPI cards sums up the period:
- Revenue and Profit
- Covers — how many people you served, with an average per table
- Avg Spend / Head
- Labour Cost — as a percentage of revenue (green at or under 30%, red above)
- Starters Sold and Desserts Sold — with their attach rate
Where last year's figures exist, each card shows a "vs last year" badge so you can see the trend at a glance.
The charts
Below the cards, the charts change with the period:
- Today shows the Live Floor (tables in use right now), the Staff Leaderboard, and Beverage Sales and Kitchen Sales breakdowns.
- This Week and longer swap in a Revenue Trend chart and Sales by Shift (your busy periods — Morning, Midday, Afternoon, Evening), alongside the leaderboard and product mixes.
Most charts have Bar and Pie toggles, so you can view them whichever way reads best.
The Staff Leaderboard ranks your team by sales, and flags anyone whose mains-per-ticket looks off — a hint that several tables may be going through on one receipt, which throws off covers. It's a nudge to check, not an accusation.
Keeping it fresh
The dashboard refreshes itself. A Last synced label shows how current the numbers are, and an Auto toggle with a 5 min / 15 min / 30 min / 1 hr dropdown controls how often it updates on its own (it's on, every 5 minutes, by default).
Seeing No sales yet today? Early in the day that's normal — figures appear once the first ticket is paid and synced from the till. If it says No POS connected, the sales integration hasn't been set up for your restaurant yet.
What's next
The dashboard is the live view. For a deeper, period-based breakdown — P&L, labour, menu engineering, and AI-written advice — see AI reports.